Nifty50, India’s most popular and widely traded NSE index, concluded the day at 19,528.75, which is a 0.56% decrease or 109.55 points down from its Friday closing level of 19,638. During the intraday trading session, it reached an intraday high and low of 19,623 and 19,480, respectively.
The opening of October month has not been favourable for the market, as it closed the session in the red today. If we observe the performance of the last month, it reached a significant milestone of 20,200 but could not sustain itself at that level and slipped from its peak, closing the month at 19,638, which was a 2% increase or a gain of 384 points.
In this article, we attempt to draw some conclusions about how Nifty may perform in October by simply analysing its historical October month performance.

| Date | Close | High | Low | % Change | Range |
| Oct-09 | 4,711.70 | 5,181.95 | 4,687.50 | -7.32% | 494.45 |
| Oct-10 | 6,017.70 | 6,284.10 | 5,937.10 | -0.20% | 347.00 |
| Oct-11 | 5,326.60 | 5,399.70 | 4,728.30 | 7.76% | 671.40 |
| Oct-12 | 5,619.70 | 5,815.35 | 4,888.20 | -1.47% | 927.15 |
| Oct-13 | 6,299.15 | 6,309.05 | 5,700.95 | 9.83% | 608.10 |
| Oct-14 | 8,322.20 | 8,330.75 | 7,723.85 | 4.49% | 606.90 |
| Oct-15 | 8,065.80 | 8,336.30 | 7,930.65 | 1.47% | 405.65 |
| Oct-16 | 8,625.70 | 8,806.95 | 8,506.15 | 0.17% | 300.80 |
| Oct-17 | 10,335.30 | 10,384.50 | 9,831.05 | 5.59% | 553.45 |
| Oct-18 | 10,386.60 | 11,035.65 | 10,004.55 | -4.98% | 1,031.10 |
| Oct-19 | 11,877.45 | 11,945.00 | 11,090.15 | 3.51% | 854.85 |
| Oct-20 | 11,642.40 | 12,025.45 | 11,347.05 | 3.51% | 678.40 |
| Oct-21 | 17,671.65 | 18,604.45 | 17,452.90 | 0.30% | 1,151.55 |
| Oct-22 | 18,012.20 | 18,022.80 | 16,855.55 | 5.37% | 1,167.25 |
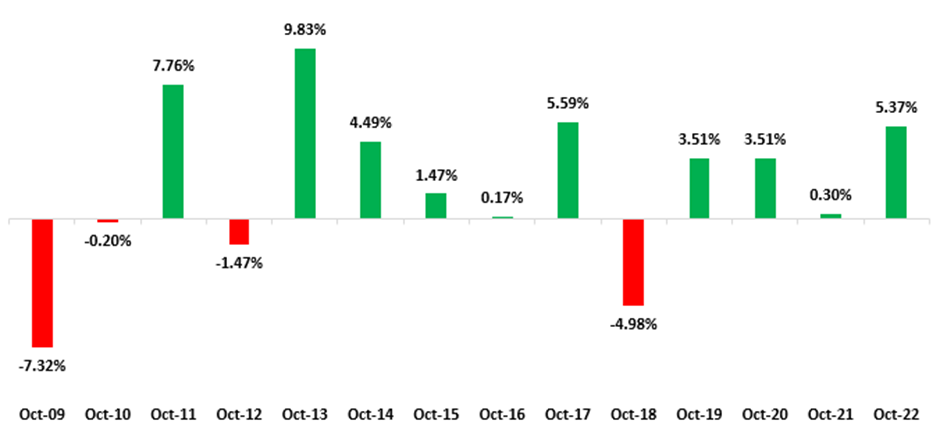
According to the data, in the last fourteen years, only four years yielded negative returns in the month of October. The most significant negative return occurred in 2009, with a loss of 7.32%, while the second biggest fall in 2018, with a loss of 4.98%. The rest two years were not that significant.
Meanwhile, in the remaining ten years, the Nifty index displayed strong performance, closing the month in positive territory. The highest return was recorded in October 2013 with a 9.83% gain, and the second-largest return occurred in 2011, at 7.76%. This suggests that there is a high probability of Nifty closing positively in October compared to closing negatively, with returns ranging from 4% to 5% this year in October.
Surprisingly, in the last two years consecutively, the Nifty50’s range, which represents the month’s high and low points, has exceeded 1,000 points. This suggests a high level of volatility during the month of October. Prior to this, Nifty’s range crossed the 1,000-point mark in October 2018.
Furthermore, when calculating the average range over the last fourteen years, it comes out to be approximately between 600 to 700 points. Out of these fourteen years, nine years have fallen within this range.
In conclusion, it is possible that Nifty may close the month positively with a range of 600 to 700 points and generate a 4% to 5% return during the month.
Disclaimer: This blog has been written exclusively for educational purposes. The securities mentioned are only examples and not recommendations. It is based on several secondary sources on the internet and is subject to changes. Please consult an expert before making related decisions.


