Base patterns are technical analysis tools used to identify potential buying opportunities in stocks or other securities. They are characterized by a period of consolidation in the price movement, where the stock trades sideways within a relatively tight range. This consolidation period is often followed by a breakout to the upside, signaling a continuation of the upward trend.
There are 2 main types of basing patterns:
Flat Base Pattern
This pattern resembles a rectangle on a price chart, featuring a relatively flat trading range with minimal volatility. The flat base usually occurs after a significant uptrend and indicates a pause in the buying momentum before a potential breakout to new highs. The pattern is considered valid when the price stays within a 15% range during the consolidation period.
Rounding Bottom Pattern
This pattern resembles a U-shape on a price chart, where the price declines to a low point and then gradually curves upwards. The round bottom often signals an end to a downtrend and indicates a potential reversal to the upside. The volume typically decreases throughout the formation and increases significantly on the breakout, confirming the reversal.
Read: Demystifying The Rounding Bottom Pattern
How to trade the Basing Pattern
- Buy on breakout: This strategy involves placing a buy order above the resistance level of the base once a breakout occurs.
- Breakout Confirmation: This strategy involves waiting for additional confirmation signals, such as a rise in volume or a crossover of moving averages, before entering a trade.
Back-to-back Base Formation
- The pattern consists of two distinct bases. These bases can be of any proper type (cup with handle, flat base, double bottom, cup without handle). Typically, the second base is flat.
- The second base should not significantly “encroach” upon the price levels of the first base. This means the second base should not dip too deeply into the price range established by the first base.
- A base-on-base formation counts as a single stage, not two separate stages. This means you don’t count the first base as one stage and the second base as another.
- If a stock climbs more than 20% from its buy point before forming the second base, the two patterns are considered separate.
This rule helps differentiate true base-on-base formations from situations where the stock has simply surged before consolidating.
It’s important to remember that base patterns are not foolproof indicators and can sometimes lead to false breakouts. Therefore, it’s essential to use them in conjunction with other technical analysis tools and proper risk management strategies for optimal results.
Examples of Base formations
Housing & Urban Development Corp. Ltd
The above chart has formed a rounding base, and the stock price is on the verge of a breakout. Until the breakout is intact, there is no point in entering the trade. Along with the pattern, it is important to watch the other parameters like volume, RSI, and EMAs.
Read: What is Exponential Moving Average (EMA)
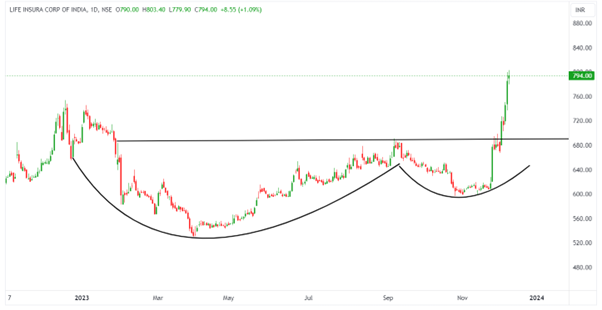
Life Insurance Corporation of India
The above chart shows the cup and handle chart pattern, which is one of the base patterns and has given rise to the breakout of the handle, continuously surging upwards.
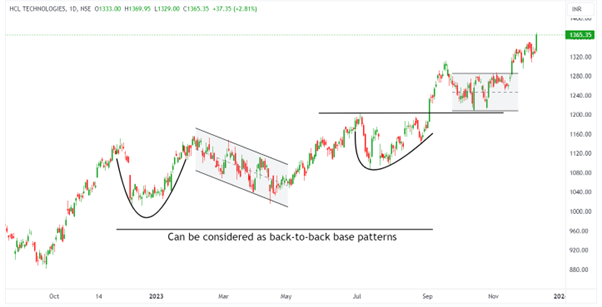
HCL Technologies Ltd
The above chart shows back-to-back bases; the base formation is not too much dipping in the previous base, so it can be considered a part of basing rather than assuming two separate bases.
Disclaimer: This blog has been written exclusively for educational purposes. The securities mentioned are only examples and not recommendations. The information is based on various secondary sources on the internet and is subject to change. Please consult with a financial expert before making investment decisions.


