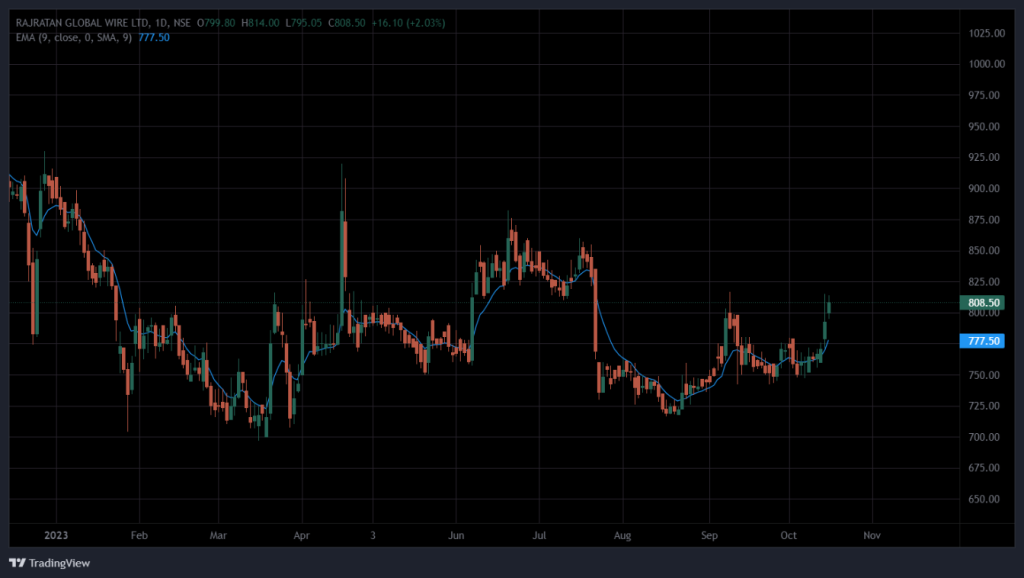
All moving averages have two characteristics in common: They smooth the data and cause lag because they depend on historical information for computation. By far the most serious implication for traders is the induced lag. Lag delays any buying or selling decision and is almost always a bad characteristic. Therefore, averaging is typically a trade-off between the amount of desired smoothing and the amount of lag that can be tolerated. There are three popular types of moving averages.
These are
- Simple Moving Average (SMA)
- Weighted Moving Average (WMA)
- Exponential Moving Average (EMA)
Each of these types of averages has its own respective merit, and there are times when any one of the three is the appropriate choice.
In the blog, we will deep delve into understanding the Exponential Moving Average (EMA). EMA is a powerful mathematical concept that offers insights into market trends and helps make informed investment decisions.
What is EMA?
At its core, EMA is a statistical calculation used to analyse and interpret data, typically the price of a financial asset such as a stock, currency pair, or commodity. It is a more dynamic alternative to the Simple Moving Average (SMA), which equally weighs all data points within a selected time frame. EMA, on the other hand, places more weight on recent data, making it more responsive to recent price movements. This responsiveness is a key feature that makes EMA a popular choice for traders and analysts.
EMA Calculation
To understand EMA, it’s important to grasp the math behind it. The formula for calculating EMA involves taking a weighted average of a series of data points, with more weight assigned to recent data. The calculation is recursive, meaning that the current EMA value depends on the previous EMA value and the most recent data point.
Here’s the basic EMA formula:
EMA = (Current Price – Previous EMA) x (2 / (N + 1)) + Previous EMA
Where:
- Current Price is the latest data point.
- Previous EMA is the EMA value calculated in the previous period.
- N is the chosen time period for EMA.
Short-Term vs. Long-Term EMA
One of the advantages of EMA is its flexibility in various timeframes. Short-term EMA reacts quickly to price changes and is often used for short-term trading strategies. Long-term EMA (e.g., 50 or 200 periods) smooths out price fluctuations and is favoured by long-term investors.
| EMA Period | Term |
| 9 /10 | Short |
| 21/26 | Medium |
| 50/200 | Long |
For instance, short-term EMA crossovers (when the short-term EMA crosses above the long-term EMA) can signal potential buying opportunities, while long-term EMA crossovers can help identify long-term trends.
Understanding Exponential Moving Averages
Interpreting Price Trends Exponential Moving Averages (EMAs) are a valuable tool for investors to gauge price momentum and potential market support or resistance. When analyzing EMAs, investors typically view a rising EMA as a potential support for price action and a falling EMA as a potential resistance. Based on this interpretation, investors often consider buying opportunities when prices are in proximity to a rising EMA and selling opportunities when prices approach a falling EMA
EMA in Trading Strategies
Traders use EMAs in various trading strategies. One common approach is to use EMA crossovers as entry and exit signals. For instance, a trader might enter a long position when the short-term EMA crosses above the long-term EMA, and exit when the opposite crossover occurs.
Additionally, EMA can be combined with other technical indicators, like the Relative Strength Index (RSI) or Moving Average Convergence Divergence (MACD), to create comprehensive trading strategies.
Limitations and Risks
While EMA offers many advantages, it’s not without limitations. EMA may generate false signals in choppy or sideways markets, leading to potential losses. Traders need to be aware of these limitations and use EMA alongside other indicators and risk management strategies.
Choosing the Right Moving Average: EMA vs. SMA – Pros and Cons
When comparing EMA (Exponential Moving Average) to SMA (Simple Moving Average), it’s essential to recognize that there’s no definitive ‘better’ or ‘worse’ choice. The advantages of the EMA are inherently tied to its drawbacks. Let’s delve into this concept:
The EMA exhibits quicker responses to price reversals, providing traders with timely signals. However, this agility can also make it more susceptible to generating premature signals. For instance, during a price retracement within an uptrend, the EMA may promptly start trending downward, potentially indicating a change in direction prematurely.
Conversely, the SMA’s slower movement may help traders stay in trades for a more extended period during short-lived price fluctuations and erratic market behaviour. Yet, this deliberate pace can also result in the SMA providing entry signals later than the EMA. Thus, the choice between EMA and SMA hinges on your specific trading strategy and preferences.
EMA in Real-World Applications
EMA is applied in various financial markets, including stocks, currencies, commodities, and cryptocurrencies. Its adaptability and effectiveness make it a universal tool for traders and analysts looking to identify trends and make data-driven decisions.
EMAs enjoy immense popularity among traders due to their unique calculation method, which places greater emphasis on recent prices while slightly trailing other types of averages.
This widely embraced stock trading tool proves invaluable in assessing optimal entry and exit points for trades. However, it’s crucial to remember that, in the stock market, the EMA should be employed in conjunction with a broader arsenal of trading tools for comprehensive analysis and decision-making.
Disclaimer: This blog has been written exclusively for educational purposes. The securities mentioned are only examples and not recommendations. It is based on several secondary sources on the internet and is subject to changes. Please consult an expert before making related decisions.


